Yield data is probably the most foundational metric farmers track today. It allows them to determine if their VR programs are paying off, versus sticking to flat-rate application. And smart farmers know that the more granular they get — tracking yield by farm, by crop, by field, by productivity zone — the more powerful the data becomes.
In a typical crop season, farmers use accurate yield estimates for several reasons, including:
► Crop insurance purposes
► Delivery estimates
► Planning harvest and storage requirement
► Cash-flow budgeting
In this article, we want to uncover some new ways to use yield data, involving nutrient use, that can have a significant impact. We'll show you how to connect yield data to nutrient removal and nutrient use efficiency (NUE), and then use those findings to make decisions that are good for your farm's bottom line, and good for the environment.
By drilling down into yield data you can sharpen your farm's finances and use resources more efficiently. Below are three ways to leverage yield data that you may not have considered.
1. Improving Your Fertilizer Budget
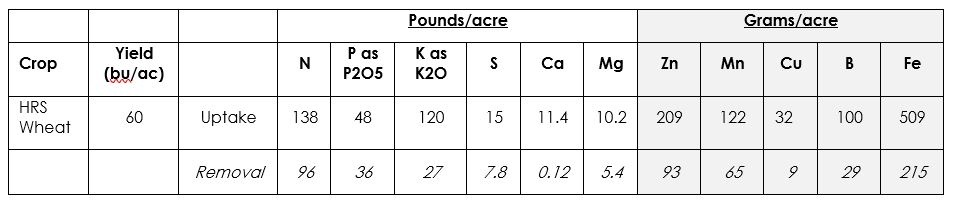
By knowing yield and then using Crop Nutrient Uptake and Removal Charts, farmers can work backwards to calculate and better understand nutrient usage and nutrient removal on cropland.
The chart below uses wheat as an example. Here, we are showing the amount of each nutrient required to grow a 60 bu/ac HRS wheat crop. Uptake is the amount of each nutrient needed to grow the crop, which will have to come from the soil and the fertilizer applied. Removal is the amount of nutrients exported off the farm with the grain that will need replacing to avoid mining soil resources. If the straw is also removed, then the total amount is exported off the farm. (Converted to current fertilizer prices, this becomes useful information when pricing straw.)
This data can be connected to field and/or farm fertilizer budgets to generate nutrient use values on a per-bushel basis. Typically, when we do these calculations, we find most growers are mining every nutrient except nitrogen. Consequently, nitrogen use efficiency is not optimized. Mining nutrients — especially immobile nutrients — is difficult to recover from and will take several years and a financial commitment to build back up to adequate levels.
2. Improving Your Fertilizer Management
When we consider improvements we can make in fertilizer management, the first step is making sure you know that what you are applying is actually getting into the crop. Understanding this results in:
- Maximum value for your fertilizer dollar
- Good nutrient stewardship
- Environmental enhancement = social capital
Let’s use the example of wheat and nitrogen utilization again. Research suggests that it takes 2.3 lbs of nitrogen to grow 1 bushel of wheat. If your number is lower than the 2.3 lbs, good on you! If it's higher, you are experiencing some form of nitrogen loss — leaching, volatilization, denitrification or excessive immobilization — and your nitrogen management program needs to be revised. Nitrogen losses can be minimized by using the 5 Rs:
Right Rate - Right Source - Right Placement - Right Timing - Right Balance
-
Right Rate(s) — What crop are you growing, what is your yield goal, what is in the soil and what will be released = how much you need to add. Getting the right rate means soil testing and sampling to depth.
-
Right Placement(s) — There are many options, including broadcast, banded (seed-placed, mid-row, side-band, dribble), foliar, as well as various application combinations. What synergies are there? What are the potential negatives? What are the seed bed utilization (SBU) implications?
-
Right Time(s) — How close to seeding or yield/quality formation will the fertilizer be applied? Are there any synergies that could be found or created?
-
Right Form(s) — Ammonium, urea, nitrate, organic, anhydrous, liquid, dry and various combinations are all form choices. How about ESN, Agrotain, N-Serve and combinations of all the above?
-
Right Balance — If yield or protein production is limited by some other nutrient, often S or K, then Nitrogen Use Efficiency (NUE) is diminished.
3. Improving Your NUE
Global NUE is < 30%. With oversimplification, this means that of every 100 units of N applied; 70 are lost to the environment where the effects are mostly negative, and only 30 units gets into the food, fuel, fiber produced in the world. Fortunately, the NUE is significantly better (50%) in North America. In this context it's important to ask the question, 'Where does my farm fall on the NUE scale?'
Nitrogen Use Efficiency can also be expanded to Nutrient Use Efficiency for each nutrient applied. If the principles of 5Rs are considered within the context of overall management — which includes water, sunlight and all the other nutrients the crop requires — then dramatic improvements in nutrient use efficiency (NUE), water use efficiency (WUE), profitability and sustainability can be seen relatively quickly.
That's why, the more granular the yield data, the greater the insights! Drilling down into yield by crop, by field and then by zone will provide even more value in understanding nutrient removals and nutrient use efficiency, while informing better management decisions in the future.