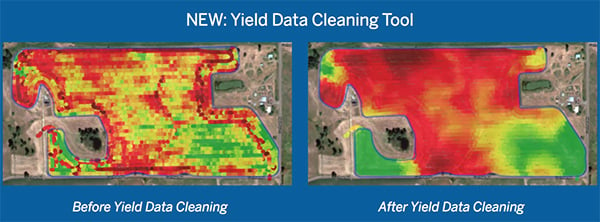
This is a question many farmers are asking, and Devon Liss is ready with an answer. The Trimble Product Development Manager has been immersed in the world of ag technology for 14 years now, with a clear focus of finding new ways to help farmers grow profitable acres, with as few tech hassles as possible.
According to Liss, clean yield data plays a major role in maximizing farm productivity (and profitability). Yes, there are many other factors at play, but without clean yield data, farmers will end up making decisions based on inaccurate yield maps — not unlike trying to navigate to your destination with bad directions.
Yield data becomes especially important when farmers are trying to get a clear handle on their fields' variability. Armed with that knowledge, they can take steps to improve profitability of each different productivity zone. For a very low producing zone with no economic fix, it may mean taking those acres out of production. For another zone, it could mean lowering inputs that won't ultimately improve yields.
But in order to make good decisions, farmers need good yield data so they're working off a clear and accurate picture of what actually happened with that crop.
"Yield data is our single best report card for what we did in a field in a particular year. It summarizes everything that happened and shows what we got as far as a crop," says Liss. "But we all know that yield data right off the monitor is an imperfect data set. Data coming off the monitor might have poor quality for a number of reasons — we might have zig-zag patterns due to grain flow delay, start-pass and end-pass delays at the end of each row, combines overlapping or not properly calibrated — either way, we know yield data has very high potential, but possibly poor quality."

The Problem
As farmers know, the accuracy of yield data depends largely on how carefully the combine operator logs data on their display. Most displays require operators to do ‘calibrations’, ie measure the actual amount of grain harvested in an area of the field (typically by weighing the grain with a scale), and then entering that weight into the yield monitor. These calibrations have to be done throughout harvest, for each crop, and as crop conditions such as moisture level or seed variety changes.
If farmers have to skip this step due to time constraints, the quality of the yield data becomes suspect — especially when more than one uncalibrated combine is being used to harvest a single field. The result? Piles of meaningless data that doesn’t match up with the reality on the ground.
Other significant impacts on yield data results are related to inaccuracies that are a function of the data collection process. Some of these issues include:
- Signal delay that causes the yield point locations to be offset from where the crop was harvested
- Incorrect or inaccurate combine header status on some points that does not account for the header being engaged
- Combine overlapping of previously harvested areas
- GPS and sensor inaccuracies that create inaccurate data
The Fix
According to Liss, some farmers are cleaning their yield data manually. This process works for some but it is clunky and time consuming. Others are turning to new yield data cleaning tools coming onto the market.
Below we've included a checklist farmers can use to help evaluate what kind of yield data cleaning tool is best suited to their farm operations. In general, your yield cleaning tool should:
-
Work on all yield data coming into Trimble Ag Software from all major yield monitors
-
Automatically remove data issues related to grain flow delays, GIS errors, sensor errors, and overlaps
-
Make it easy to correct poor yield data caused by harvesting with multiple combines
-
Provide a way to correct yield data values using actual harvest amounts collected from scale tickets or other sources
-
Provide the following outputs for each yield set:
-
Calibrated Yield — includes all corrections and adjustments made to the raw yield layer, in harvest units
-
Normalized Yield — puts all yield on a scale of 100 where 100 represents 100% of the average yield for each field. This makes it easy to compare yield from year to year, even when different crops were raised.
According to Liss, while every farmer will have their own preferred way to manage yield data, the ultimate goal is, the cleaner the better — for you, and your bottom line.
Looking for a tool that checks off all of the above? Learn more about Trimble's new yield data cleaning tool today.


